 General indicators Natura 2000 angiospermae
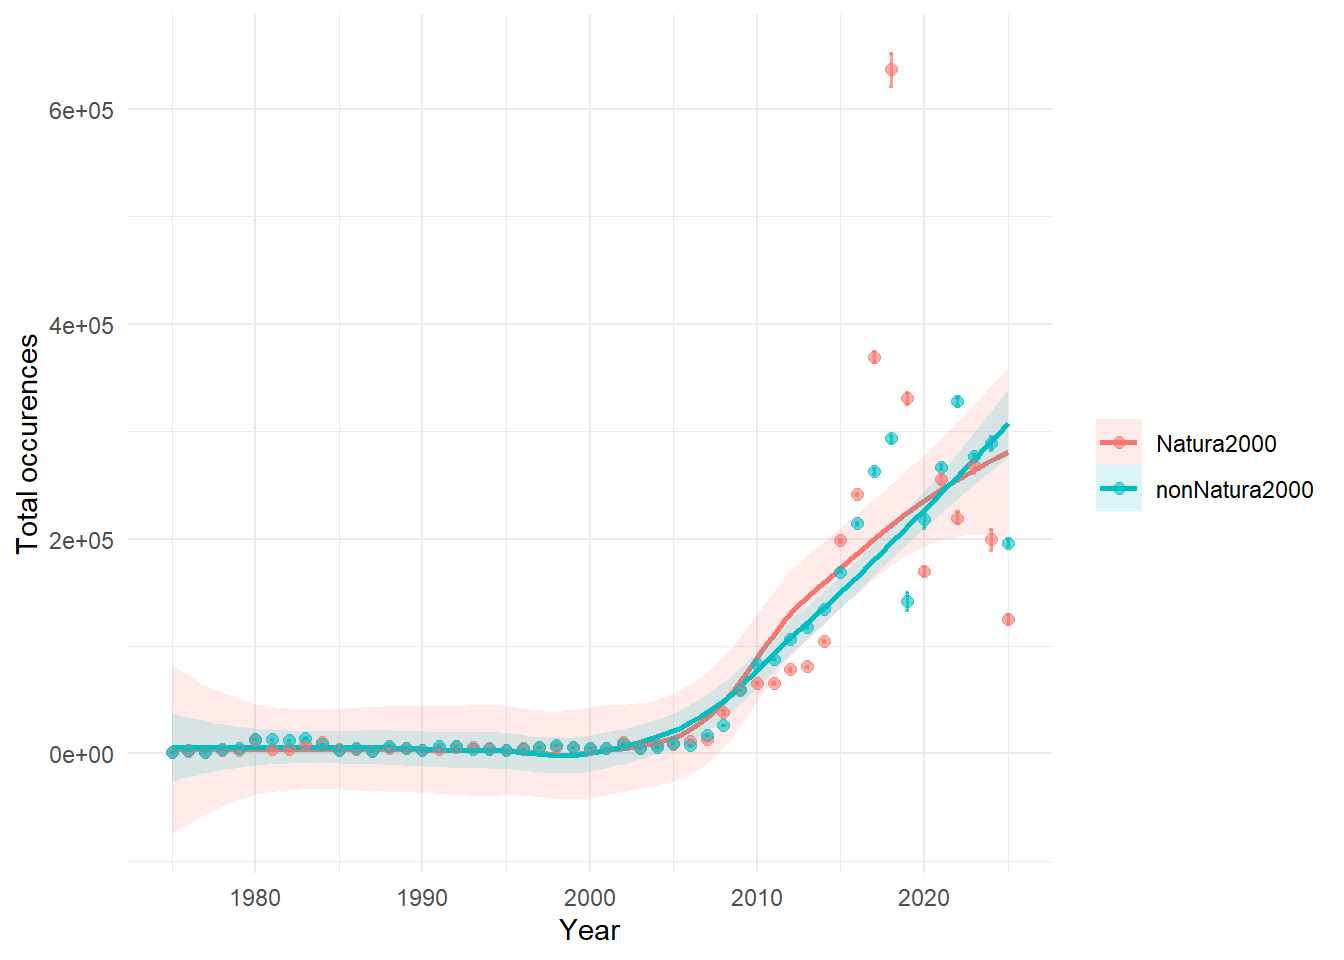
TipTotal Occurrences
This variable quantifies the overall number of species occurrence records per year in Natura2000 versus nonNatura2000 area. While not a biodiversity indicator itself, it is crucial for understanding data comprehensiveness and distribution. It is presented as a map showing data density or a time series of annual record counts.
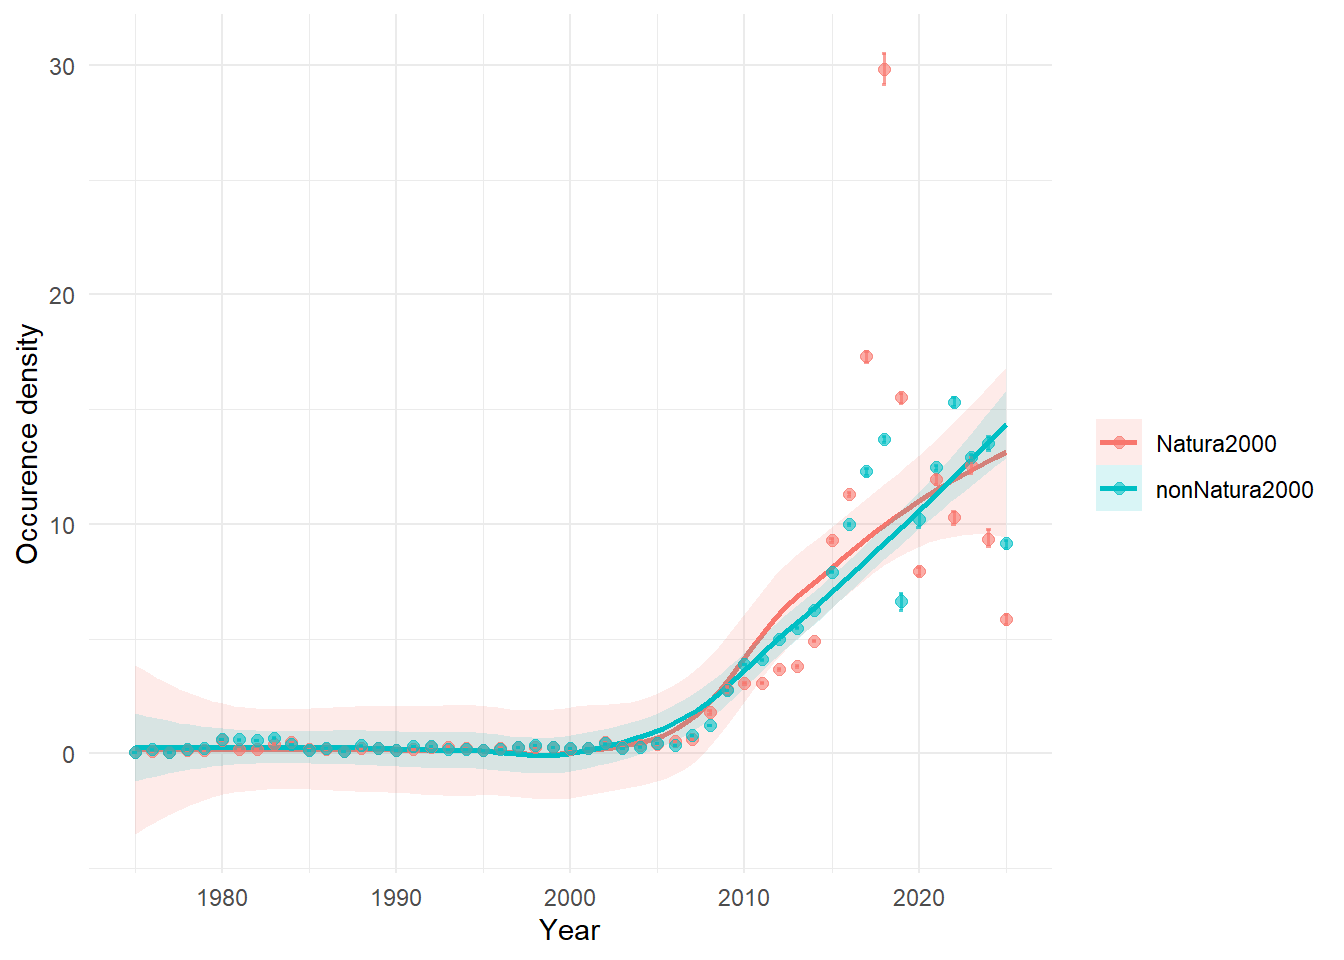
TipOccurrence Density
Occurrence Density measures the spatial concentration of records by calculating the total number of occurrences per square kilometre. This allows for more meaningful comparisons between spatial units of different sizes.
TipRarity
Rarity quantifies the scarcity or infrequency of species, and when summed over multiple species, serves as a crucial biodiversity indicator for conservation. b3gbi offers two distinct measures: Abundance-Based Rarity (based on species’ proportional occurrences) and Area-Based Rarity (based on species’ spatial occupancy). These can be mapped (indicator_map) to identify areas with a higher presence of rare species, or tracked over time (indicator_ts) to observe changes in overall rarity.
Abundance - Based Rarity
Area-based rarity
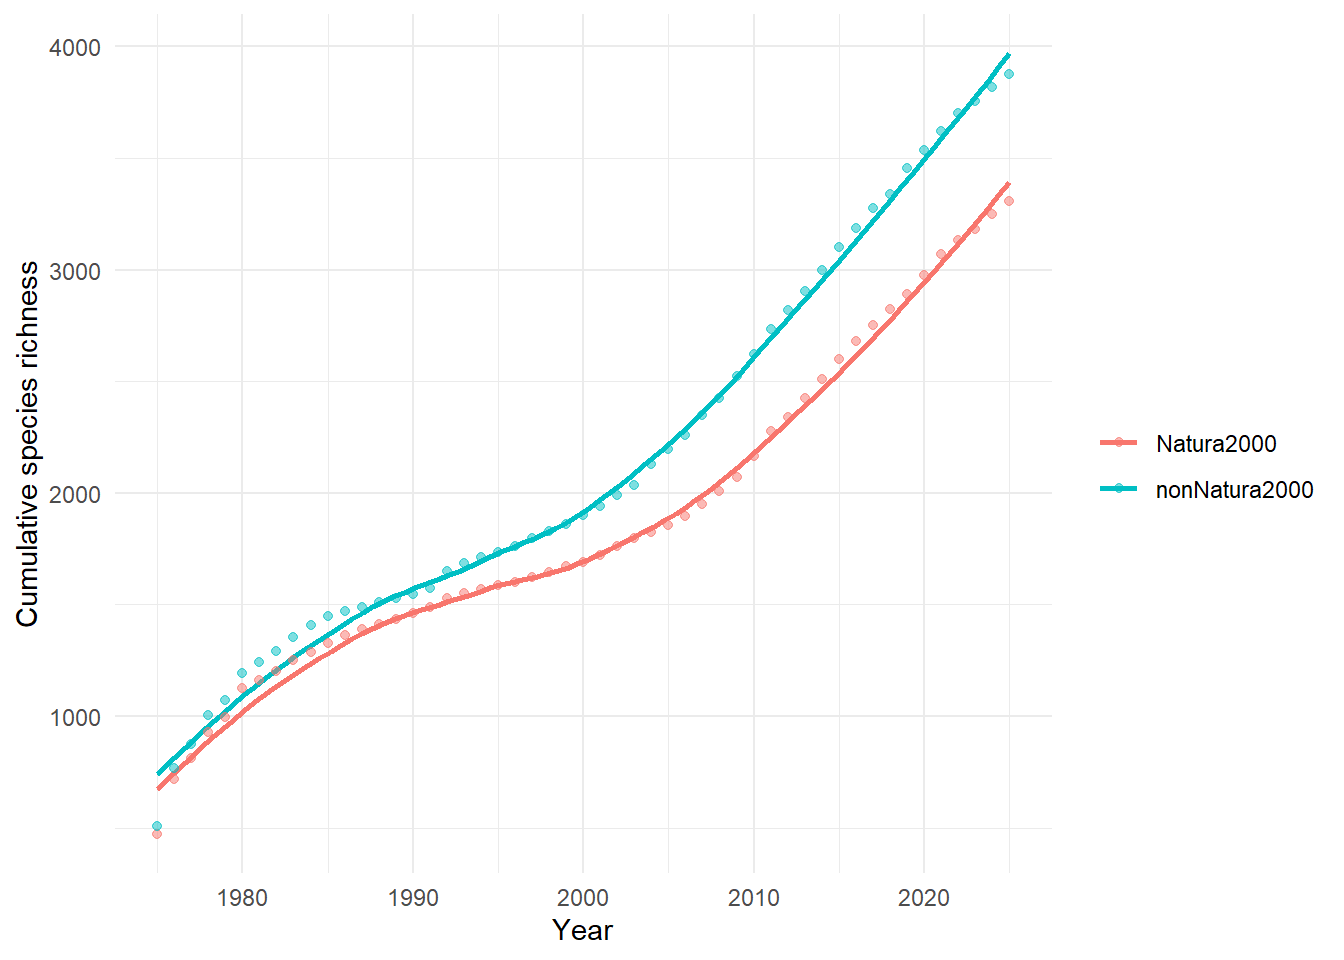
TipCumulative Species Richness
This indicator tracks the total number of unique species observed from the beginning of a specified time period up to a given year. It provides an estimation of how many new species are still being recorded over time within a region, helping to evaluate sampling effort and assess the overall recorded biodiversity over the study duration. This is an inherently temporal indicator, presented as a time series (indicator_ts).
TipMean Year of Occurrence (Newness)
This variable calculates the average year of occurrence for all records within a given spatial unit (e.g., grid cell, for indicator_map) or temporal unit (e.g., year, for indicator_ts), providing an estimation of the relative recency of observations. Maps can highlight areas with more recent average records, while time series show the average observation date over cumulative data.
TipOccupancy turnover
Occupancy Turnover measures the rate at which occupancy composition changes over time within a community, quantifying the balance between species “gains” and “losses” between consecutive time intervals. High turnover indicates a dynamic community with frequent species replacement, while low turnover suggests stability. This is an exclusively temporal indicator, presented as a time series (indicator_ts).